Have you ever got into situation in office where you need to count the cells in Excel sheet with specific color? If yes then you can use following code which counts the number of cells with specific color (here it is yellow) and put the count in cell
It is worth to mention that the above code does not count the cells where colors are coming through conditional formatting. You can use DisplayFormat.Interior.Color to get the conditional formatting colors (DisplayFormat.Interior.Color works only on Excel 2010 or above) or read this post
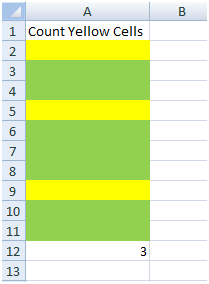
Public Function CountColorCells(rng As Range) As Long
    'Variable declaration
    Dim lColorCounter As Long
    Dim rngCell As Range
    'loop throught each cell in the range
    For Each rngCell In rng
        'Checking Yellor color
        If Cells(rngCell.Row, rngCell.Column).Interior.Color = RGB(255, 255, 0) Then
            lColorCounter = lColorCounter + 1
        End If
    Next
    'Return the value
    CountColorCells = lColorCounter
End Function
To use this code in your Excel file, follow below steps:
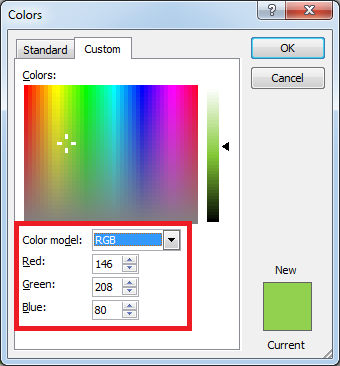
Here I have counted the cells with yellow color. You can change RGB (#,#,#) code to count other colors. You can find RGB codes of any color using following steps
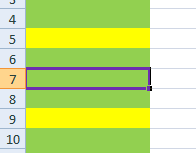
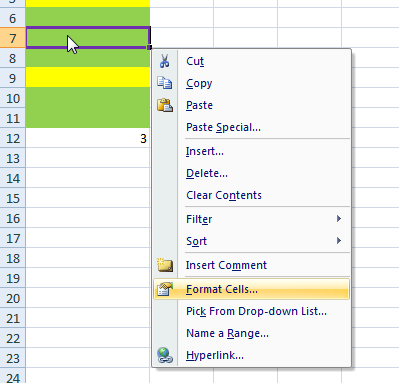
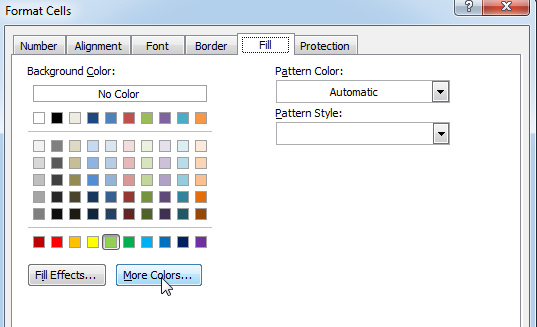
That’s all, in the ‘Color’ dialog box, you can view the RGB (Red, Green, Blue) codes of the color
If you are look for a code to sum the cells based on it’s color then you can read this post.
In this tutorial, I will show you three ways to count colored cells in Excel (with and without VBA):

This article will show you how to create a timeline for Excel PivotTables and charts, making it easy to explore your data in a fun and interactive way. Imagine you have your data neatly arranged…

The tutorial explains what the Compound Annual Growth Rate (CAGR) is and shows how to create a clear and easy-to-understand formula for calculating CAGR in Excel.

How to Insert Symbol in Excel? Have you ever faced the challenge of using special character symbols in number formatting or customized number formatting? It is easy to insert any symbol in numbers i.e Delta…

Filter in Excel is an essential tool that helps to display relevant data. It eliminates the irrelevant entries temporarily from the view. This tool filters data according to the criteria to help analyze the critical data points

Understand how to find median in Excel with simple steps. Understanding the middle value in a set of numbers, known as the median, is important in the data industry. Professionals often use Microsoft Excel to calculate this. Excel’s MEDIAN function helps quickly find this value from long lists of numbers. This saves time and allows for further calculations using the median value. In this article, we explain what the MEDIAN function in Excel does, why it’s useful, and two methods to find the median in your data.
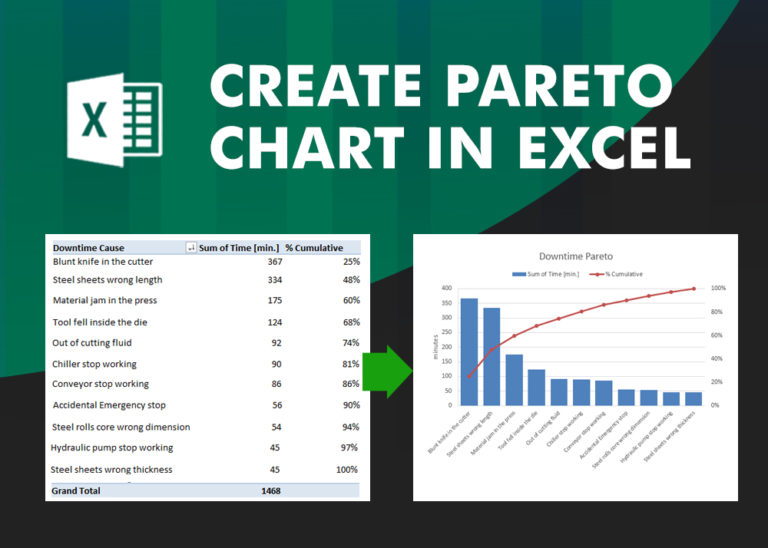
What is Pareto Chart? Pareto principle was introduced by Italian Economist Vilfredo Pareto. He stated that 80% of the effects are caused by 20% of the causes. So if we closely monitor and solve 20% of…
It doesn’t work with conditional formatting because the cell color does not really change
This code does not work with conditional formatting however we made it work. So please read below article to count colored cells with conditional formatting.
Count Colored Cells with Conditional Formatting
Hope you like the article. Please comment if you liked the solution. 🙂
Happy Reading!
Great tips! I always struggled with counting colored cells in Excel, but your step-by-step guide made it so easy to follow. Thanks for sharing!
Thanks.
Great tips! I never knew counting colored cells could be so straightforward with Excel. Thanks for breaking it down step by step!
Thank you for the feedback. Keep learning 🙂
Thank you for this detailed guide! Counting colored cells in Excel always seemed tricky to me, but your step-by-step instructions made it much easier to understand. I can’t wait to try it out in my own spreadsheets!
Thank you so much for your feedback. Keep learning 🙂