How Histogram Works in Excel? (Definitive Guide)
Histogram Chart
Histogram was first used by Karl Pearson and It is a tool which helps to understand the data points and its distribution among different groups.
In layman language, this charts divides the data into multiple range groups with same interval i.e. 1-5, 5-10… and then plot the data into these groups to find the distribution among these group. So that you may understand, what are the major areas which has large impact or your major data fall. This helps the user to understand the nature of your data.
Histogram is different from bar chart as bar charts works with two data variables however Histogram works with one data variables (numeric). The intervals/groups used in this graphs are called bins/buckets and this bins are created with same interval or width. These bins are consecutive and non overlapping intervals.
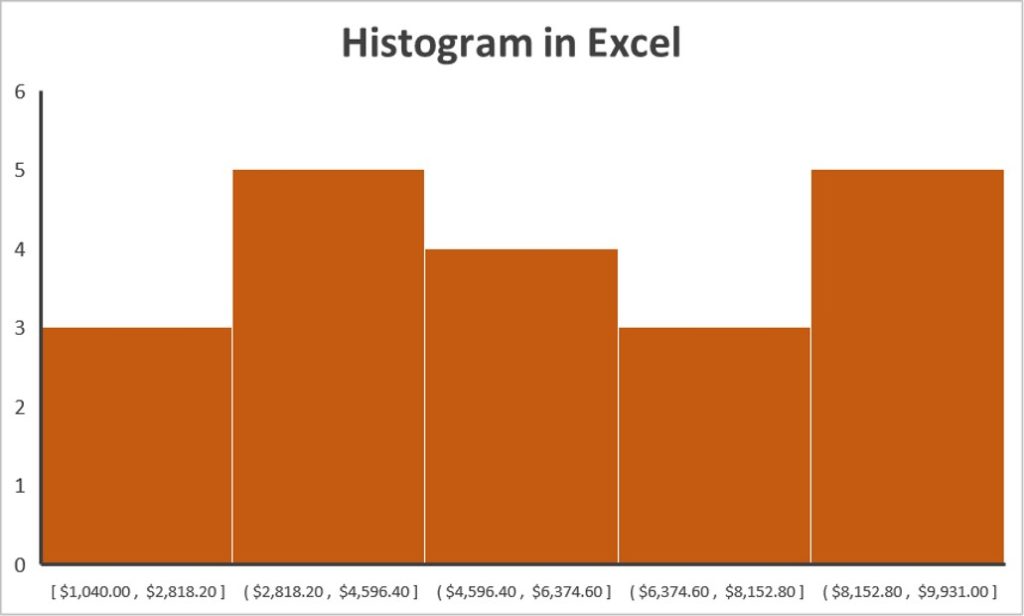
This Histogram will look like as below:
Histogram Excel - Things To Know
- Histogram works with one data range/variable and group the data into multiple bins. Bins basically can be called as Range Interval i.e. 5 to 10, 10 to 15, 15 to 20...
- Histogram helps to estimate the probability distribution of data into different categories
- This is different from bar chart and Excel has inbuilt chart for this. There are different ways to use this in Excel depending on the Excel Version (Detailed Guide Below)
- Histogram create the group with same width and intervals. It overlaps each other, so there is no gap in columns
- Helps to analyze the data structure and its occurrence into different categories
How to make Histogram Chart in Excel?
There are different ways to create Histogram chart in excel depending on the excel version you are using:
Histogram Options For Excel:
- Create Histogram in Excel 2016/Above versions or Office 365
- Create Histogram in Excel 2010/2013 or prior versions
Create Histogram in Excel 2016 and above versions
Suppose we have sales number data for sales rep against the target of 100. Now we want to know the common target achieved in different categories
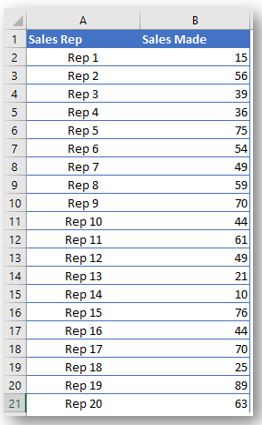
Steps to Create Histogram Chart in Excel 2016 and above versions
– Select your excel Data and Go To Insert Menu on the top Excel Menu
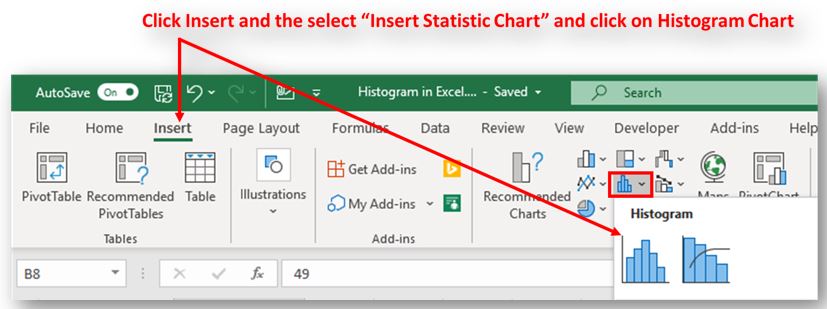
– Once you click on Histogram chart, you will see a chart on your window. Right click on the horizontal Axis (x-Axis) and click format Axis:
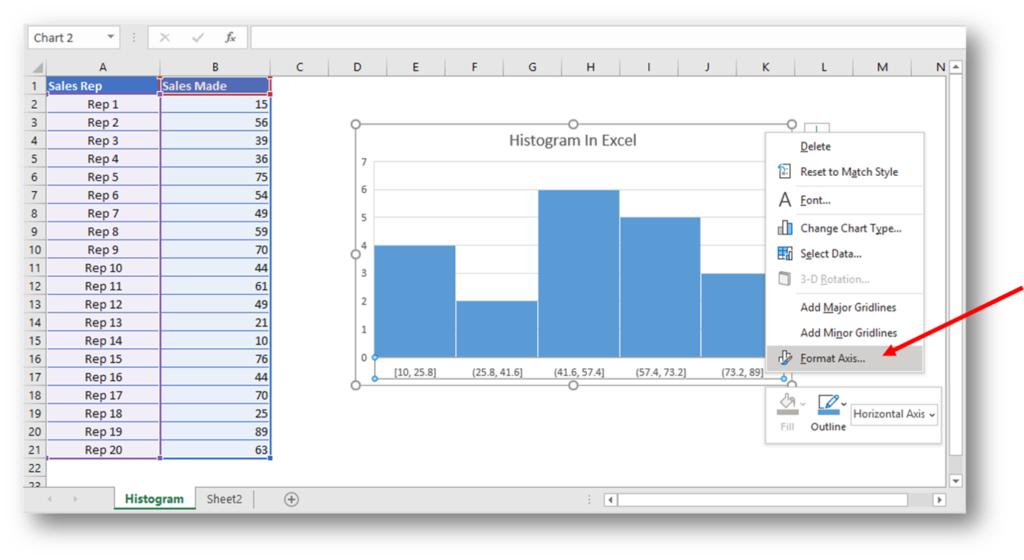
– Once you select format Axis, you can change the chart parameters i.e. Bin Width, Bin Numbers, Overflow Bin, Underflow Bin etc
- Category: If you want to show your data category wise instead of Group intervals. This gonna help you. This is similar to column chart
- Bin Width: It helps the user to define the bin Width which is an interval for each Bin. So for example, you want to group the data by interval size 10. This will look like as 5-15, 15-25, 25-35 etc. You can change the group size by using this option
- Number of Bins: This helps the user to create the number of bins as when you insert a histogram chart, it automatically creates 3-4 bins however you can change the bin numbers by using this option
- Number of Bins: This helps the user to create the number of bins as when you insert a histogram chart, it automatically creates 3-4 bins however you can change the bin numbers by using this option
- [Overflow bin]: This is an optional feature which you may use to restrict the last bin to consolidate all data points if flows after defined value i.e. 75<
- [Underflow bin]: This is an optional feature which you may use to restrict the first bin to consolidate all data points if falls before user defined value i.e. <10
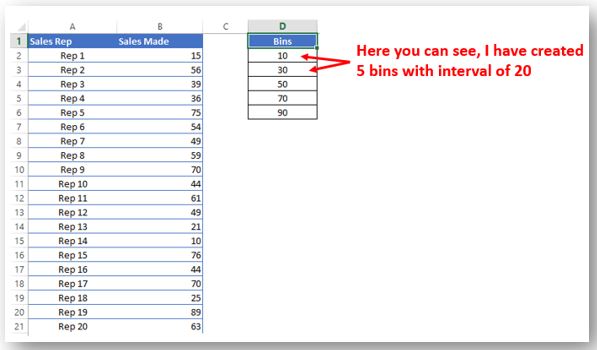
Create Histogram in Excel 2013/Prior Versions
For this we need to install an ADD INN which is available along with MS Office installation “Analysis ToolPAK”. You may learn “How to install Excel ADD INN“ in order to install “Analysis ToolPAK”.
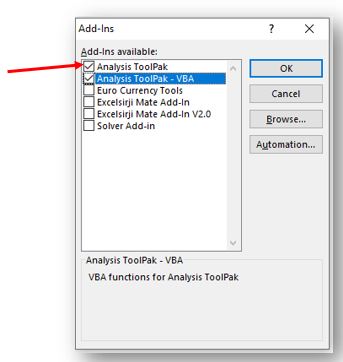
Once you activate the above ADD INN. Then you will be able to see this data analysis option under “Data” menu and click on Data Analysis

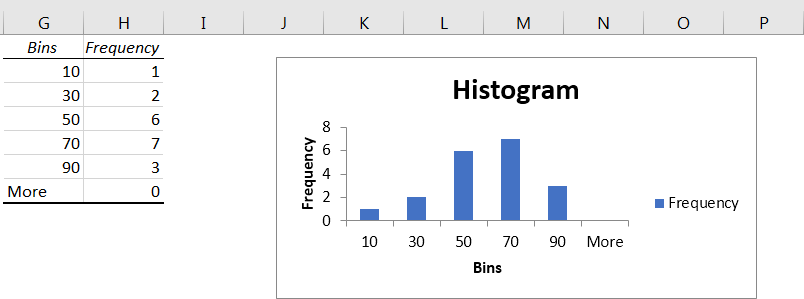
Now you select “Histogram” and click Ok. Now you need to create bin starting point with equal intervals. See below:
