While preparing many projects, my clients always want me to make professional, good looking dashboards. So I hide few things like Gridlines, Column & Row headings and Formula Bar. This can give WOW experience to your bosses, clients because after hiding these features, you excel sheet looks like a software or an application. See below example:
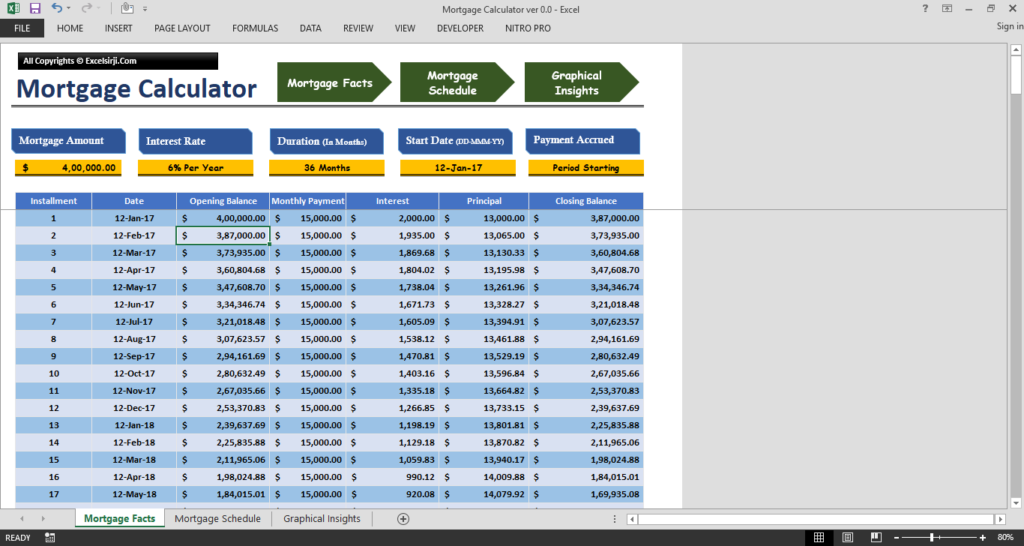
Do you like this below Project Snapshot when compared with above? Scroll Down
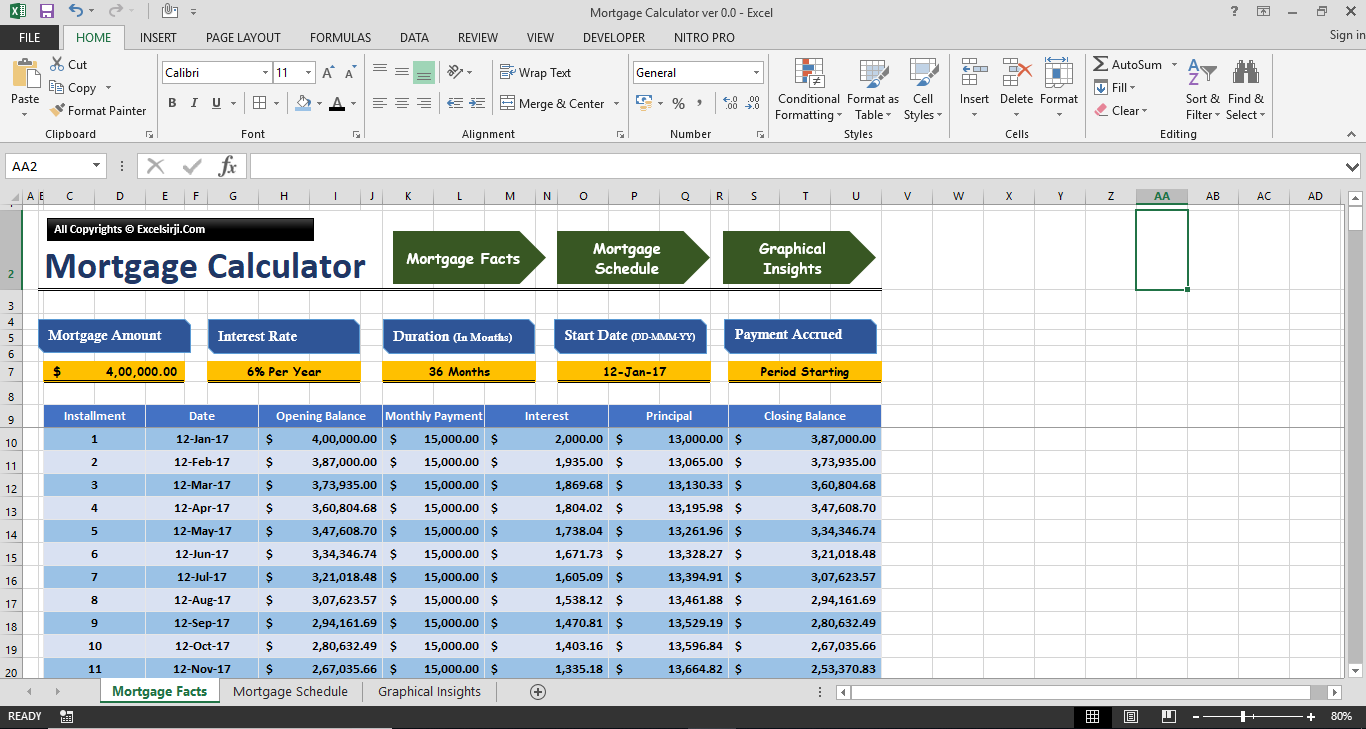
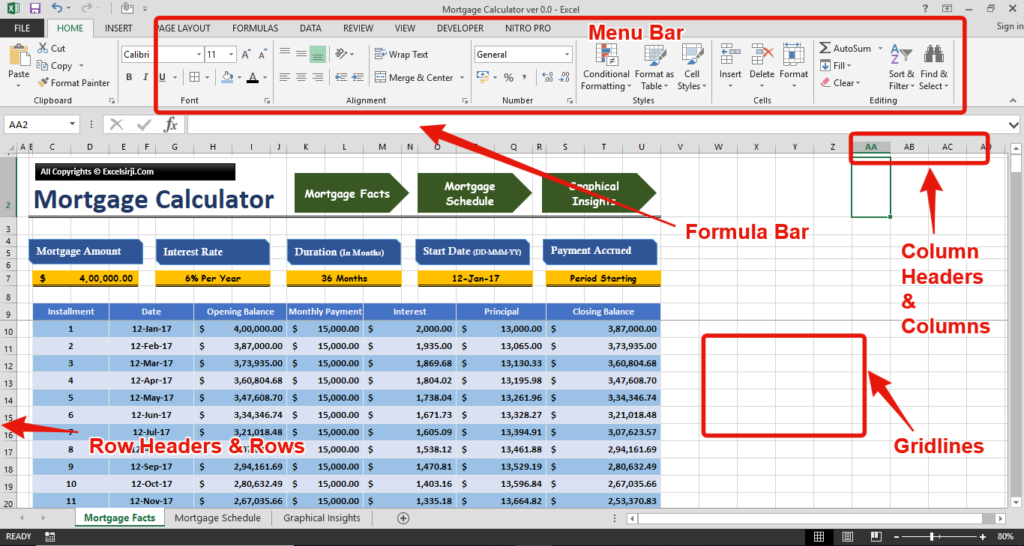
Below are the features which we may hide to make our projects more appealing:x
Go To Menu Bar > Select View Tab as below

Uncheck the “Formula Bar”, “Gridlines” & “Headings”. See below to understand what would happen:
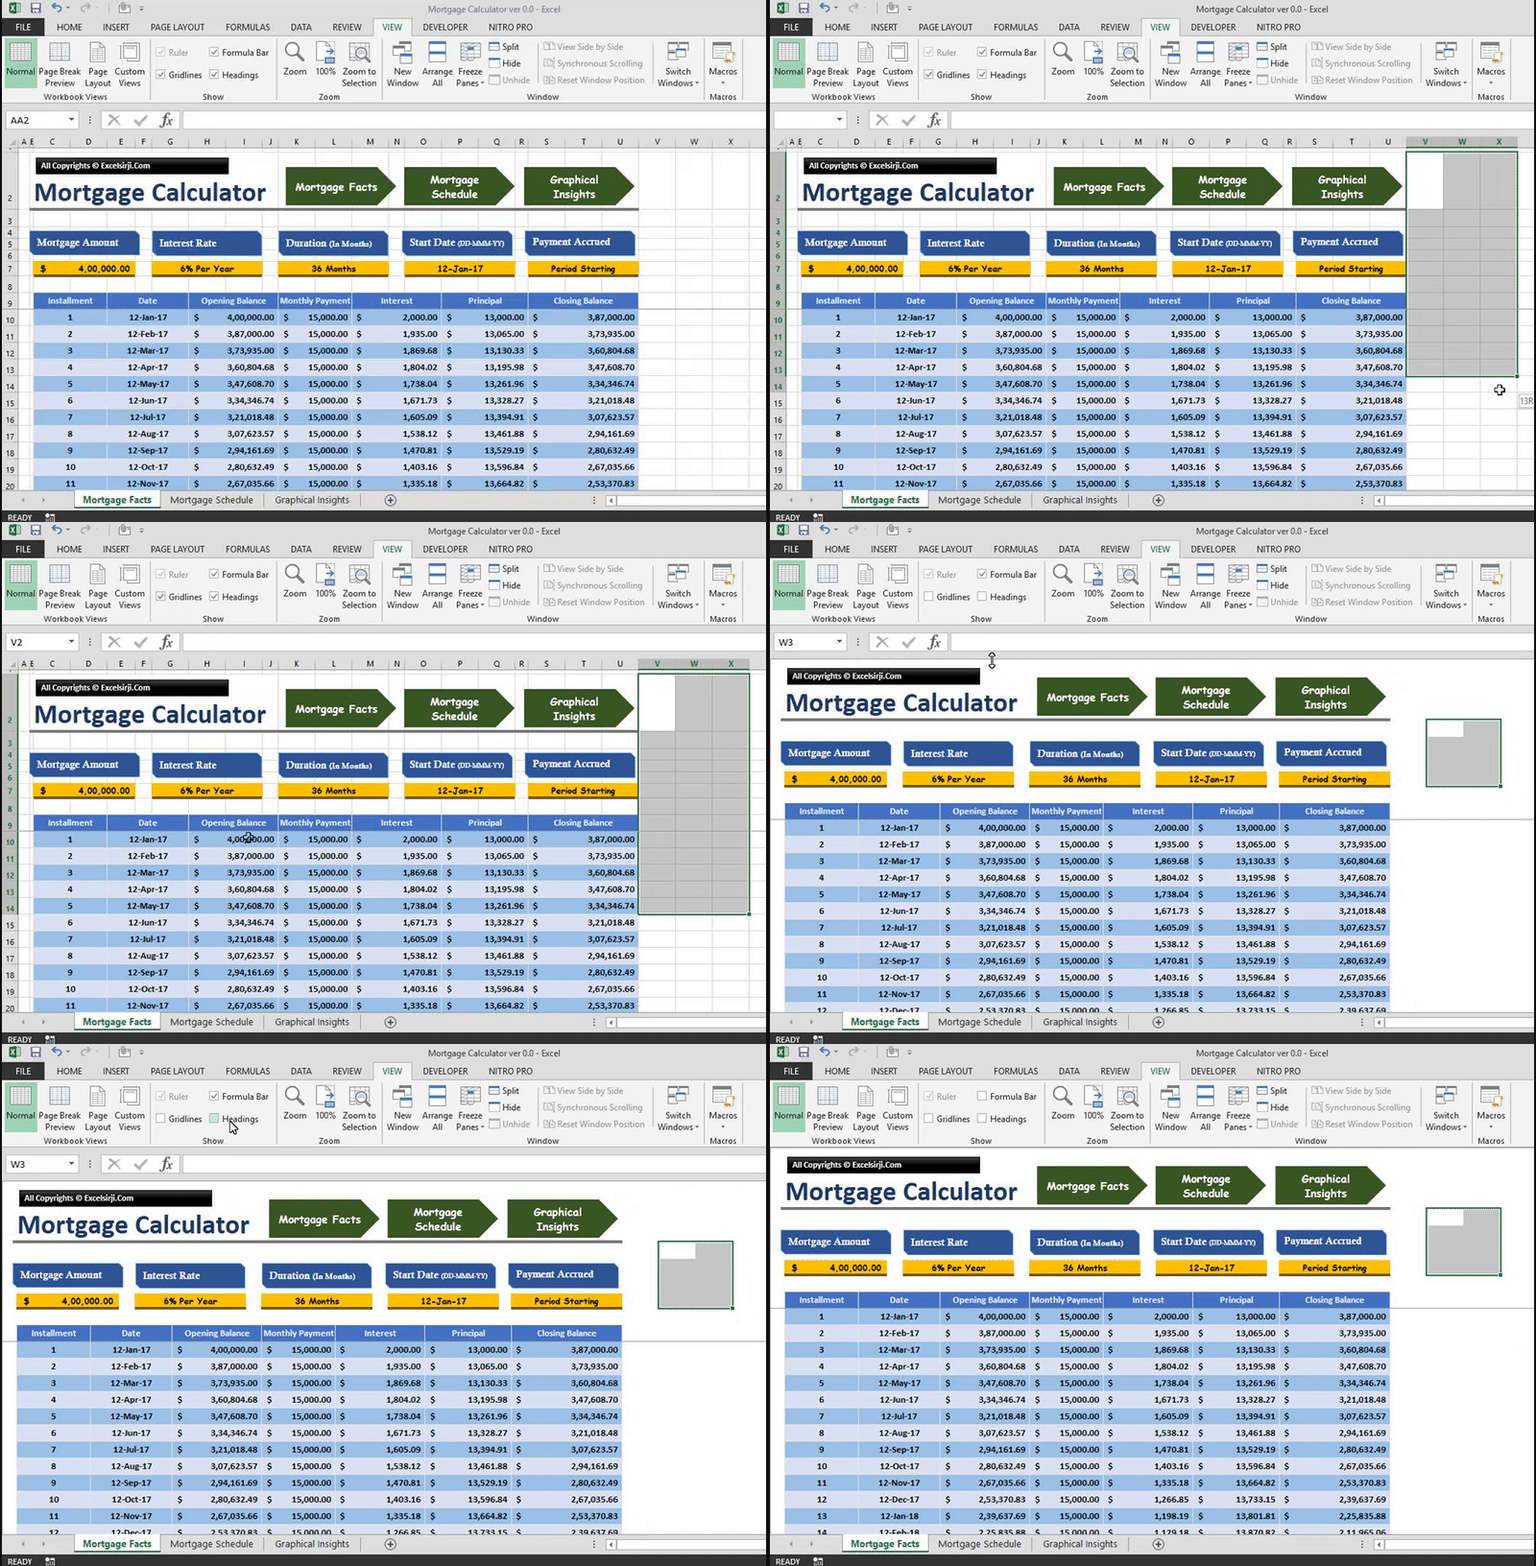
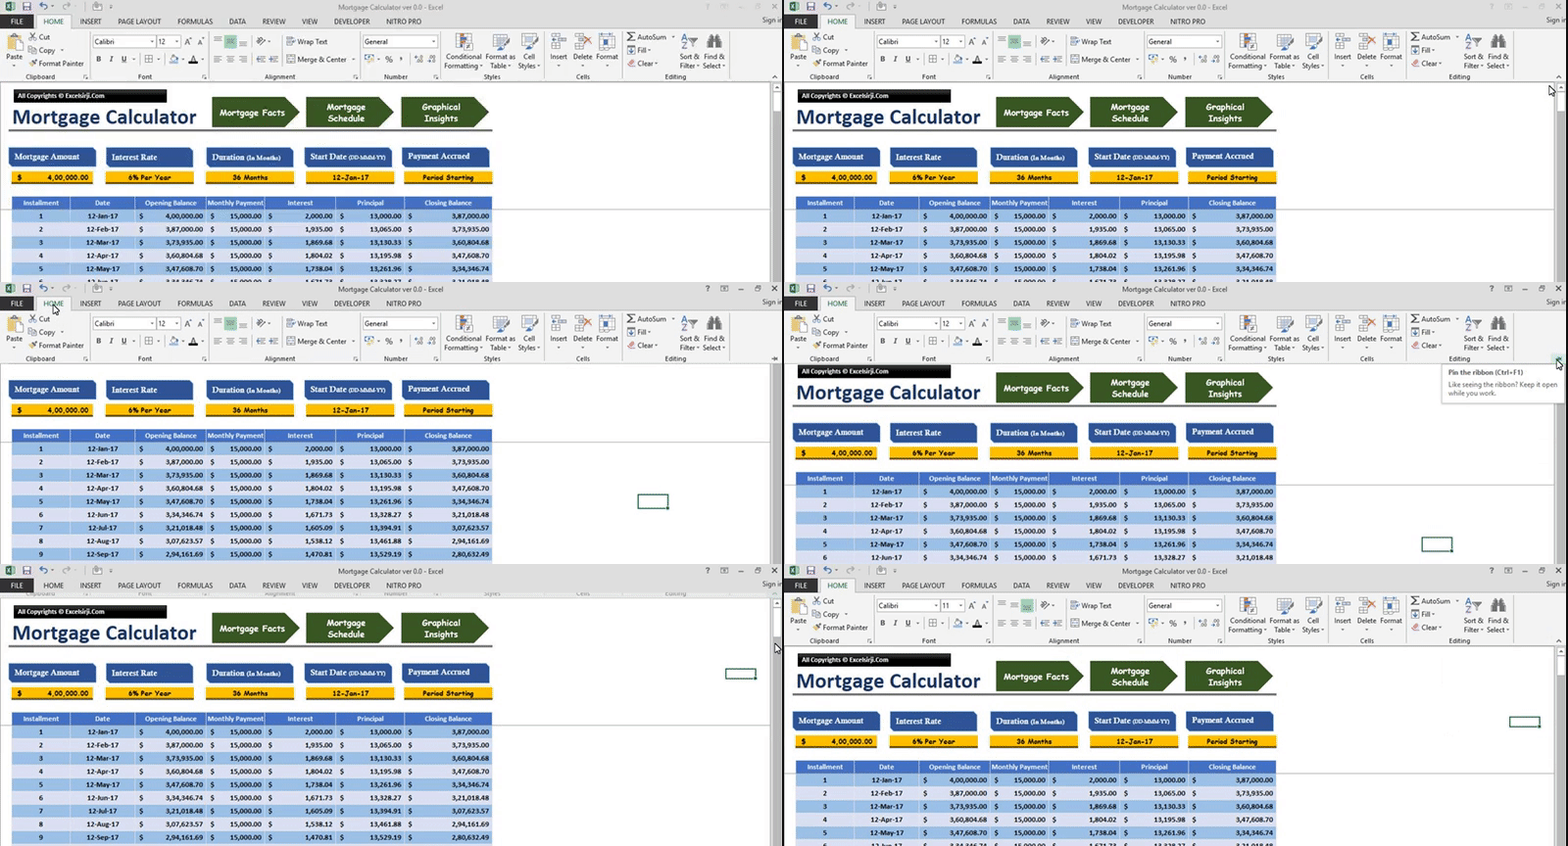
Sometimes Menu Ribbon occupies the space on your Monitor screen. So you may hide the Menu Ribbon, if it is not needed. See below:
If you have blank rows and Column which would not be used during the entire tenure of the project or you might have done some calculations in those columns. You may hide those by following below simple steps:
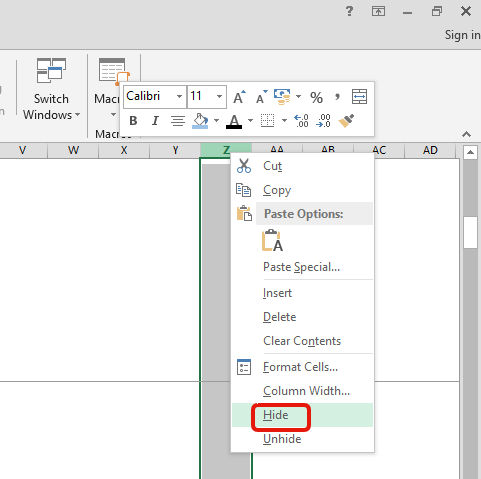
Select any column or columns and Right click on the header and Click “Hide”
Similarly you can select rows, right click and hide the rows. There is another method to hide rows and column which explained in below image:
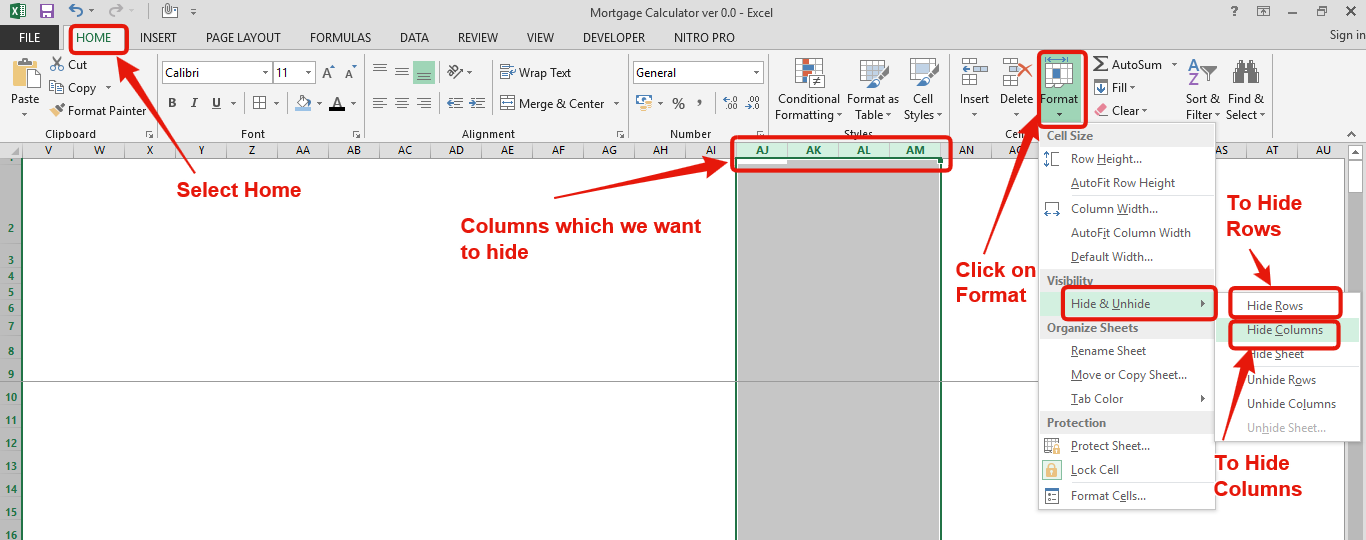
These highlighted option can hide your rows or columns
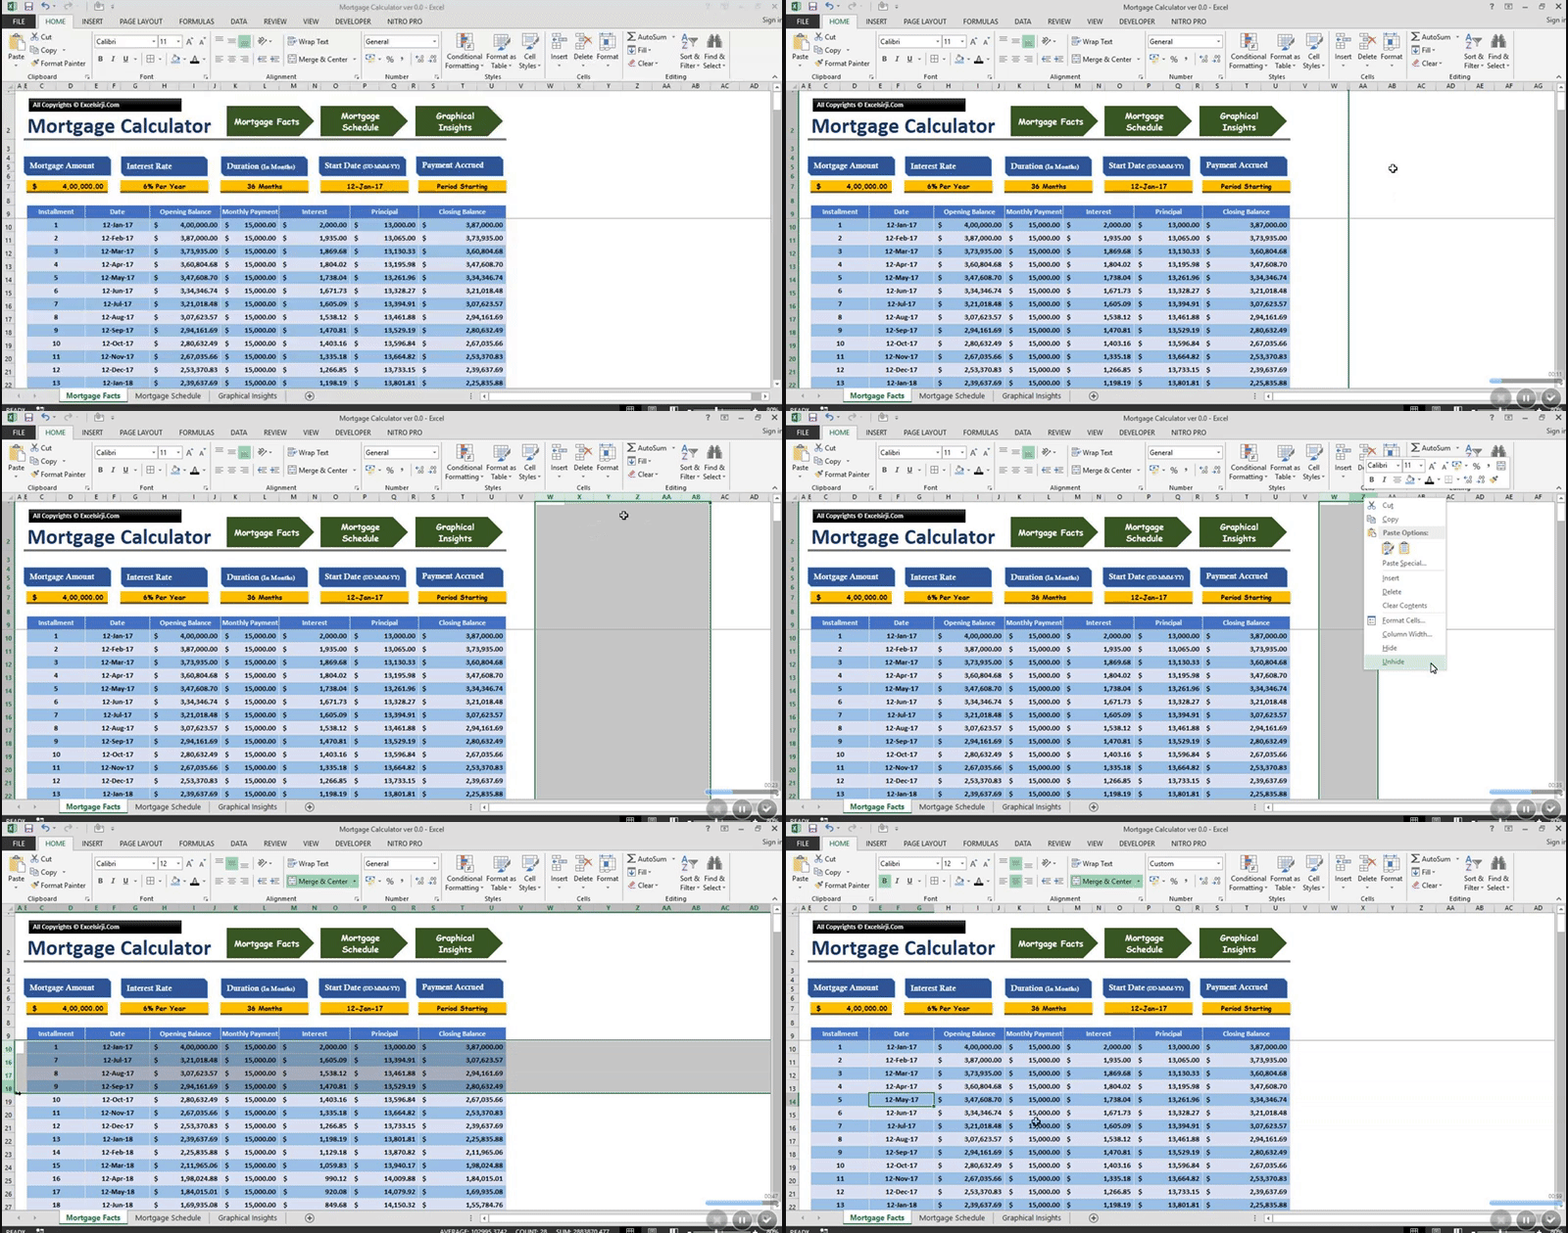
By following the same process you may Unhide Rows/Columns as you can see in the above image, there is an option to Unhide Rows or Unhide Columns.
See below small gif image which may help you to understand the same:
Hope you like this article. Please share your views and comment below.

In an “IF function” there will be two output i.e. TRUE or FALSE since either the statement will be “TRUE” or “FALSE”. If the statement is matching or correct, then output will be “TRUE” or if the statement is not matching or not correct then the output will be “FALSE

In Excel, a line break lets you finish one line of text and begin another within the same cell. It helps create separate lines of information without needing to move to a different cell.

FIND function is used to find the position of text, or character in an available string.

The tutorial explains how to use the CHOOSE function in Excel, showing you the basics and some interesting examples. While CHOOSE might seem simple on its own, when you combine it with other functions, it can be powerful. Essentially, the CHOOSE function helps you pick a value from a list based on its position. The tutorial also covers some advanced ways to use CHOOSE that you might find very useful.
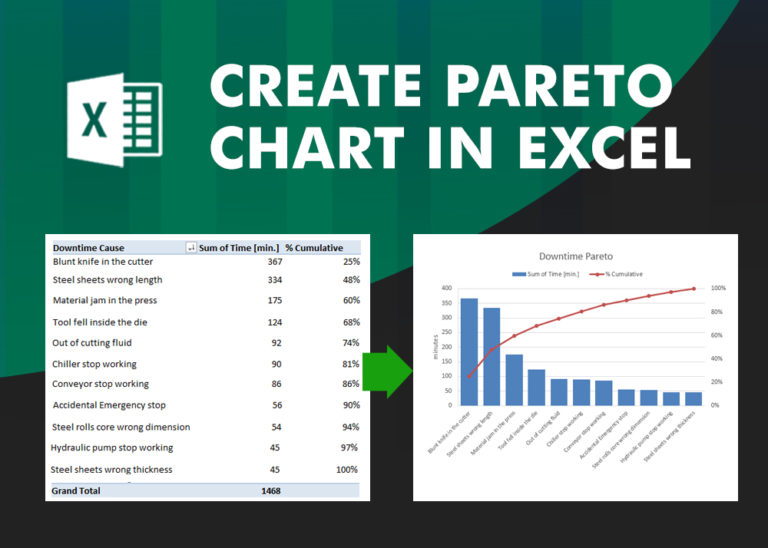
What is Pareto Chart? Pareto principle was introduced by Italian Economist Vilfredo Pareto. He stated that 80% of the effects are caused by 20% of the causes. So if we closely monitor and solve 20% of…

You must have faced a condition when your data cells contain extra spaces, leading spaces or trailing spaces and you wanted to remove these extra spaces to standardize the data. So here you may use…