MIN function is used to get the smallest number in range or list of values.
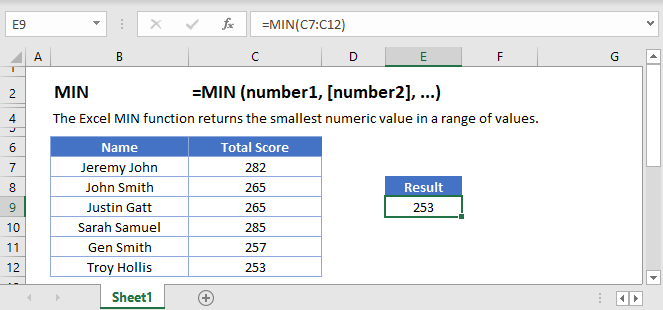
Below is the MIN formula in Excel.
=MIN(number1,[number2],...)
number1 argument is required argument where we can give range or value
[number2] argument is optional argument where we can give another range or value
… refers that, we can add multiple range or values by separating them with comma ( , )
The MIN function in Excel is very easy to use. Let us understand the working of the MIN function in some examples.
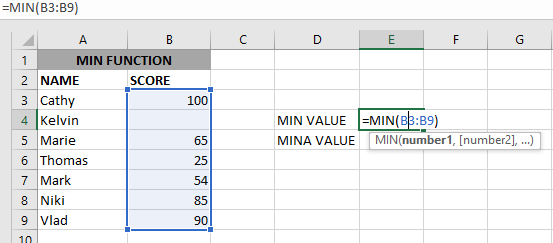
As we can see by applying the formula we got the Minimum score. The result is 25.
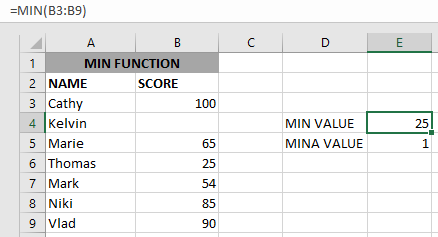
The Excel function ignores empty value cells and result is 25. But MINA Value will be 1 as shown above.
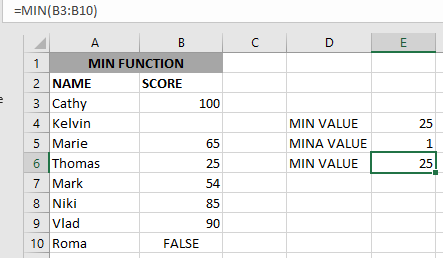
if we provide a logical value, the function will ignore it and will give the same result, but MINA will consider it, as shown above:
– Function will only consider numeric values while evaluating the smallest value
– Multiple ranges can be applied in function by separating them with a comma (,)
– Text/ Spaces will be ignored by the function
– If No values in the range or list of values (i.e. number argument) then the output will return as 0 (zero)
Hope you learned this Function,
Don’t forget to leave your valuable comments!

In this tutorial, you will learn 3 effective approaches How to Extract First Line in Excel of text. formulas, regex. In data analysis, Excel is a powerful tool that helps make difficult tasks easier. One…

Watch: How to use WORKDAY & WORKDAY.INTL Function in Excel? What is WORKDAY Function? The WORKDAY function in Excel calculates a date that is a specified number of working days before or after a given date. It…

Discover an incredibly easy way to insert a picture into a cell using the IMAGE function! For years, Microsoft Excel users had to go through a long and tricky process to add pictures to worksheets….

COUNTA function is used to get the total count of Any-value or Non-Blanks in range. COUNTA Function has one required and optional argument: value1, value2

How to Create a Pivot Table? Pivot Tables in excel is backbone of data analysis in excel. If you want to perform various analysis in excel, then I would suggest, learn this amazing excel feature…
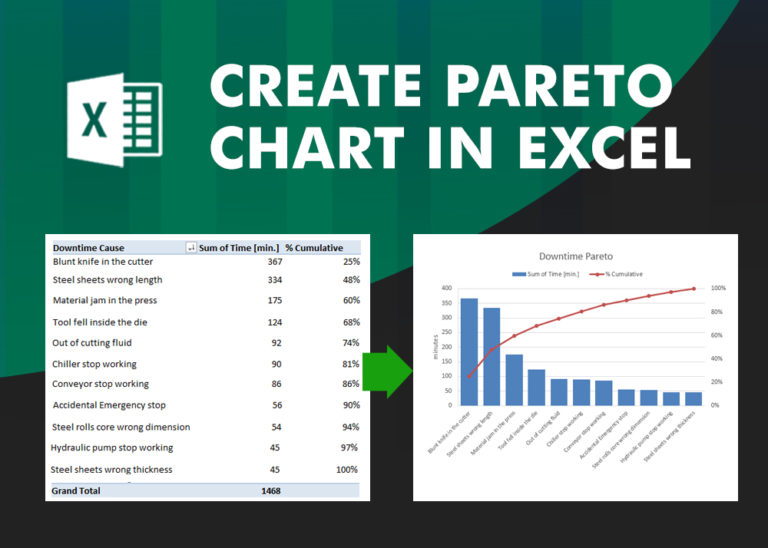
What is Pareto Chart? Pareto principle was introduced by Italian Economist Vilfredo Pareto. He stated that 80% of the effects are caused by 20% of the causes. So if we closely monitor and solve 20% of…