While working with Microsoft Excel, did you get any situation where you need to count the number of characters in a cell or string? I believe most of your answers are YES. In the said scenario “LEN” function will help you to find the solution. We will be learning the Microsoft Excel “LEN” in detail, so stay with us and continue reading…
=LEN(text)
text argument, is used for counting number of characters in available string.
LEN Function has only one argument i.e. text, which makes the function easy to apply and understand. We need to give the cell reference of the string to the text argument.
If cell reference is not correctly provided in the function, then it will give output as “#VALUE!” (Error). So always ensure that function parameters are correctly applied to get the appropriate results/output.
LEN function is very advantageous in many ways. It helps for the document where count of characters from an available string is required. Counting characters from an available string manually (one by one) in a report is very difficult and LEN Function helps to apply the function in large database at once and makes the work easy, saves time and increases efficiency.
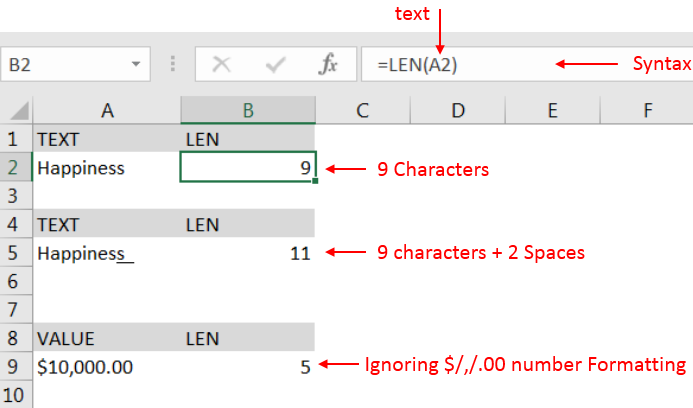
– Number formatting will be ignored i.e. $10,000.00 output result will be 5 (for 10000) ignoring “$”/”,”/”.00” number formatting
– Space available in a string is counted as character
– Function should give output in “General” format, however if output is not as per the desired format then we need to change the cell format to “GENERAL”.
text argument, “Column A” contains strings and characters needs to be counted.

Explanation:
– Cell “A2” has string i.e. “Happiness” with total 9 characters as per function output in cell “B2
– Cell “A5” has string i.e. “Happiness + 2 spaces” that is why function output is 11 as per cell “B5”
– Cell “A9” has numeric value i.e. 10000 with number formatting, output returns value ignoring number formatting i.e. $/,/.00
Hope you learnt this Function,
Don’t forget to leave your valuable comments!
If you liked this article and want to learn more similar tricks, please Subscribe us or follow us on Social Media by clicking below buttons:

An ultimate guide for basic user to understand Excel Vlookup function. VLOOKUP is a vertical lookup which helps the user to extract the values from other columns (leftmost) basis on matching column string.

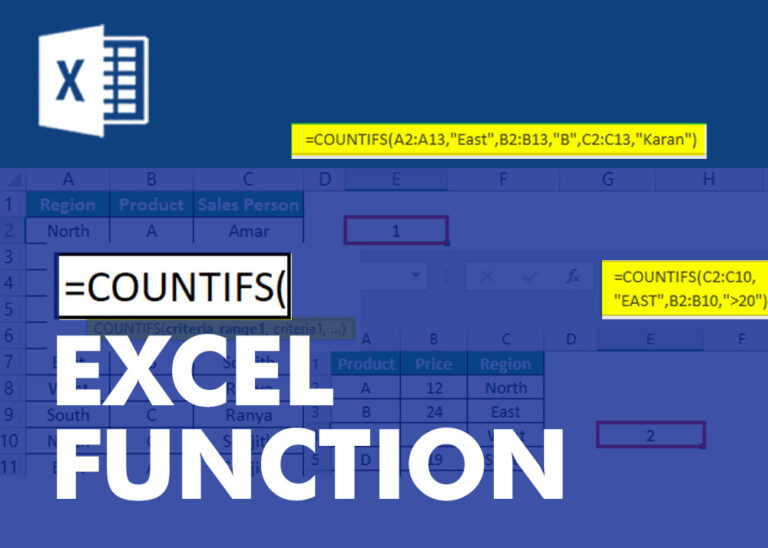
COUNTIFS function is used to get the total count for number of times the various criteria across ranges are met.

UPPER function is used for changing the text/string to UPPER case in Microsoft Excel. The output of the function returns value in new cell.

Discover free videos and tutorials to master Excel formulas and functions. Practice directly in our Online Excel Practice Files without downloading anything. Have questions? Drop them in the comments. Let’s begin! Basic Excel Formulas and…

In this tutorial, we’re going to explore one of the most intriguing features in Excel: the OFFSET function.
So, what is the OFFSET function in Excel? Simply put, OFFSET gives you a reference to a range of cells that’s moved from a starting point by a certain number of rows and columns.

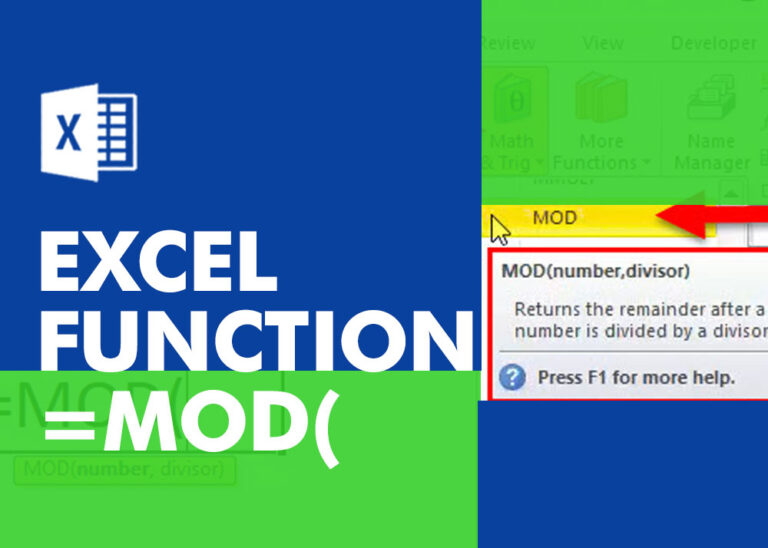
MOD function is used to get the remainder of number that is divided by divisor. MOD Function has two required arguments i.e. number and divisor.
Very well explained LEN function.