=ROW(reference)
reference argument is used to give the cell reference for which row sequence number is required
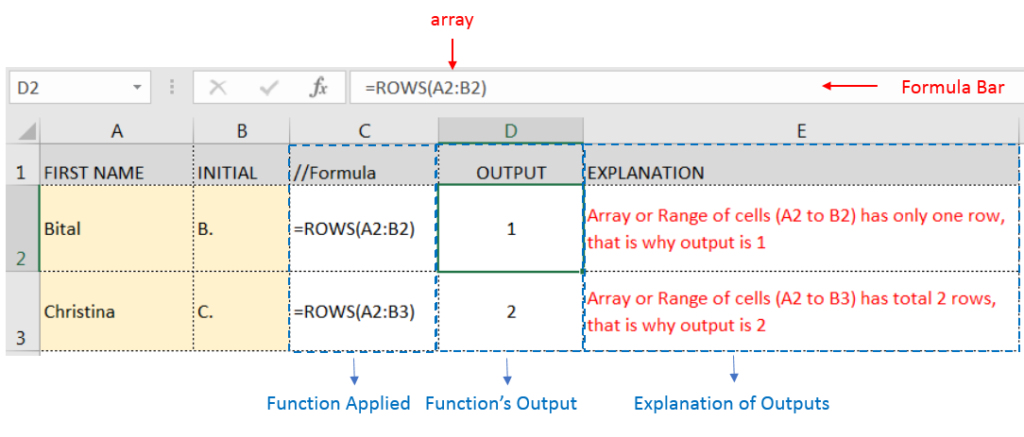
Here we have some examples, where:
We will be using ROW function as follows:

– If Range of cells given in reference argument, then function output will be leftmost row sequence number
– If cell reference is not given in reference argument, then function output will be row sequence number of formula cell
Hope you learnt this Function,
Don’t forget to leave your valuable comments!

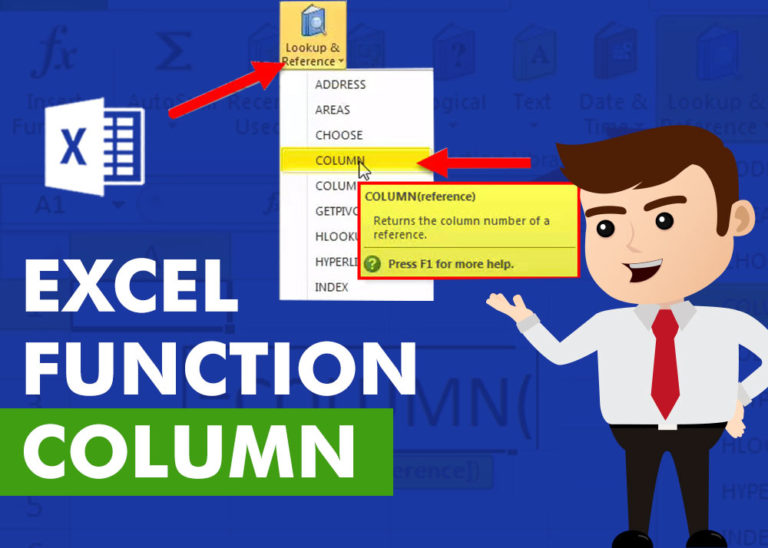
COLUMN function is used to get the column reference number of the excel worksheet. COLUMN Function has only one argument.

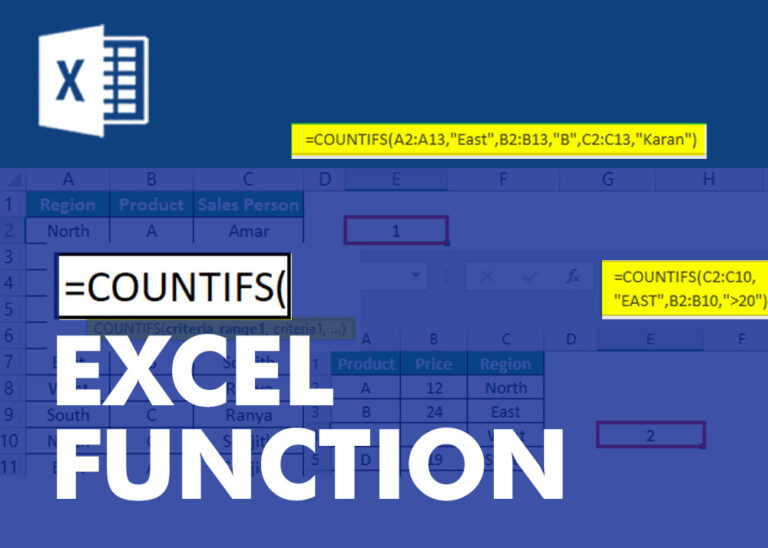
COUNTIFS function is used to get the total count for number of times the various criteria across ranges are met.

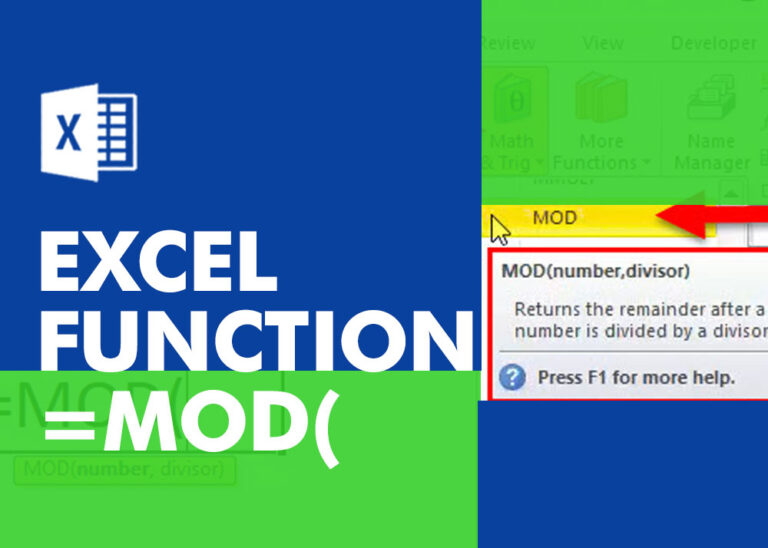
MOD function is used to get the remainder of number that is divided by divisor. MOD Function has two required arguments i.e. number and divisor.

SEARCH function is used to find “position of character or text” in an available cell and this function is NOT case sensitive.

AVERAGE function is used to get the average of numbers. Function applies formula i.e. average = Sum of all values / (Divided by) number of items.

Watch: How to use WEEKNUM Function in Excel? What is WEEKNUM Function? The WEEKNUM function in Excel returns the week number of a given date. It is a DATE and TIME function that can be…